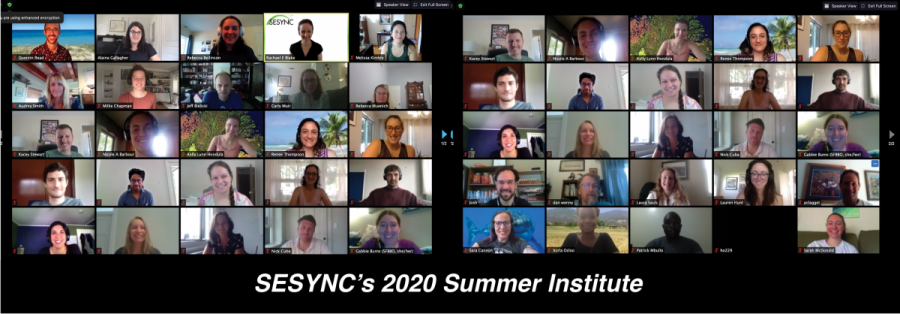
This year, SESYNC's data science team really put the “cyber” in its annual Summer Institute on Cyberinfrastructure for Socio-Environmental Synthesis—adapting their usual in-person program to be entirely Zoom-friendly. Even with this new format, participants found they were able to gain valuable, applicable data skills that helped advanced their research.
Each year, the Summer Institute, led by members of SESYNC’s data science team, gives research teams the opportunity to enhance their data and coding skills. The institute places particular focus on helping teams learn how to script complete data pipelines and implement distributed workflows within the R + RStudio development environment. SESYNC staff are also available to provide advice on a wide range of workflow and methodological challenges to help teams achieve their specific project objectives. Participants include both currently supported SESYNC research teams, as well as teams from outside SESYNC.
Kacey Stewart, a participant in this year's event, leads a graduate student pursuit exploring the connection between narrative and ecological systems. “In particular we are focusing on the oyster industry in Maine and using newspaper coverage as a way to see how these narratives emerge and evolve over time,” he explained.
Stewart said he was interested in the institute because he wanted to increase his understanding of programming languages to help both his SESYNC project and his individual research. His team hoped the institute could help them write some code that they could use to analyze their text data. "One of my key takeaways was the importance of version control and git," he shared. "The lessons in that area really helped us to develop an effective approach to collaboration."
This focus on helping researchers develop the skills needed to advance their existing team projects was a key advantage for Stewart.
He said, “I really liked how project-focused the institute was. The way we and our coach were able to adapt the lessons to our own project needs gave our project a major boost.”
Stewart said his team has already been able to apply some of the knowledge that they learned during the institute to enhance their project. “We are currently revising the code developed that week to continue cleaning our data and better address our research questions,” he shared. “I am hoping to apply some of these skills to my own work by incorporating more computational approaches to text analysis”
Gabbie Burns, a waterbird biologist, from the San Francisco Bay Bird Observatory (SFBO), was a member of a participating research team from outside SESYNC. Gabbie said her team chose to attend the institute because they wanted to learn more about R Shiny, which they hoped to use to build applications that would enable them to share their data with the public in an accessible way and facilitate the possibility for future research collaborations.
Burns said, “My biggest takeaway were the hands-on Shiny skills that we took from the lesson tutorial and the links to resources like the component libraries. And the realization that Shiny isn’t as intimidating as we thought it would be! Though less directly relevant in our case, I am also glad to have gotten exposure to the lessons on text processing and GIS. Now I have an idea of what capabilities R has and some background to research further should I need them.”
The skills that Burns’ team learned during the institute actually helped them to build a functional prototype of a Shiny application by the end of the week. She explained that the goal of the app was to present their nearly 40-years of data from their bird banding station in a way that’s easier to access and navigate.
She shared, “Our Shiny app graphs key summary metrics from our banding data and allows viewer to select which combination of species they want to see in the graphs. There is also an option to graph annual abundance alongside one of several economic or weather metrics and generate a correlation between the factors. Our plan is to work with our Outreach team to develop some educational text to explain why certain factors might influence the bird presence/behavior.”
After planning to demonstrate the application to their colleagues following the institute, Burns said they hoped to finalize it and publish it SFBO’s website. “This resource would be linked on our website and could be used as an educational tool for the general public and/or as a way to introduce our data with potential partners/collaborators.”
“Ideally, we will be able to continue to expand on it in the future and make similar apps to share our data/research findings from other projects as well,” she added.
Even though the institute had to move online, participants felt that they were still able to take away valuable skills.
“I think the workshop would have been amazing in person, but I appreciate how much effort was put into making it a positive virtual experience,” Burns said. “We appreciate the opportunity that this workshop provided to dive into a project idea and receive support throughout the process.”
You can learn more about the institute here.